T4 Evolution™
Stop Funding Future Fantasies While Your Core Machine Is Burning.
Most executive boards struggle with corporate strategy because their roadmaps are buried under 80-page slide decks that hide actual operational risks. Isolate your hidden capital risks and align your executive team with The T4 Evolution™ framework.
The Invisible EBITDA Tax™ Calculator
Quantify the hidden cash leakages inside your operations and discover the valuation gap you can reclaim.
1. Operational Friction Metrics
1
1
1
2. Strategic Valuation Adjustments
80%
8.0x
Annual Waste Diagnostic Summary
Manual Labor Leak:
$249,600
Fixed Software & Tech Debt:
$30,500
Interdepartmental Handoff Leak:
$72,300
Key-Person Firefighting Drag:
$78,000
Total Annual Hidden EBITDA Tax
$430,400
Potential Bottom-Line Cash Reclaimed
$344,320
Implied Enterprise Valuation Expansion
$2,754,560
Calculated by multiplying your reclaimed operational margins by your target strategic exit multiple.
Ready to stop funding operational chaos?
Secure your paid 90-Minute Strategic Alignment Workshop with ARM Consulting.
T1: TURNAROUND:
Focuses on cost containment, cash stabilization, and securing the baseline pillars (Defined, Informed, and Transparent).
T2: TRANSITION:
Standardizes workflows, retires legacy tech debt, and automates processes for replication (Effective, Efficient, and Consistent).
T3: TRANSFORMATION:
Automates advanced continuous audit loops (Reviewed, Adaptive),
T4: TRANSCEND:
Eliminates key-person dependency and hardcodes a self-sustaining innovation pipeline (Independent, Innovative).
Eliminates key-person dependency and hardcodes a self-sustaining innovation pipeline (Independent, Innovative).
PROOF OF METRIC VELOCITY
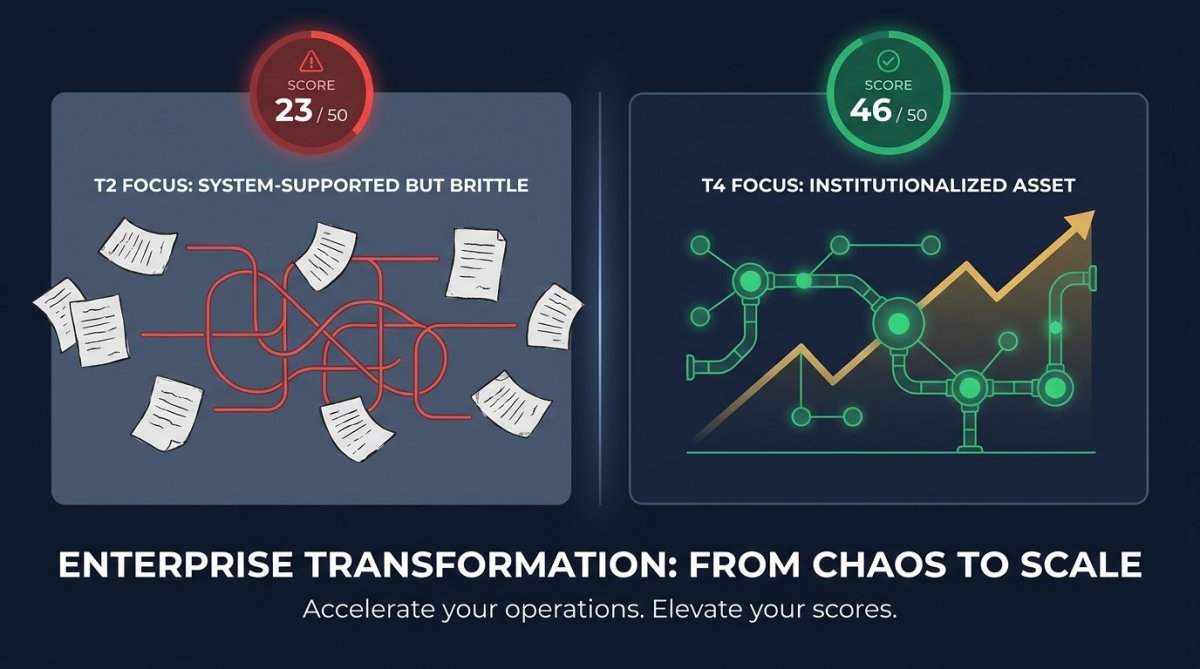
Logistics Corp: Operational Transformation Matrix
Verified pre-scale baseline vs. post-optimization benchmarks (50-Point Maturity Scale)
| Strategic Profile & Ratios | Before State (Founder Chaos) | After State (Institutional Asset) | Core Operational Lever |
|---|---|---|---|
| Enterprise Maturity Rating | 23 / 50 (Brittle) | 46 / 50 (Antifragile) | Standardized SOPs & RACI Process Owners |
| Operational Leverage (OLR) | -5.33 (Margin Decay) | +3.10 (Transcendence) | De-risked baseline & removed double-negative trap |
| Operations-to-Revenue Divergence | -15.5% (Hidden Cash Bleed) | +12.0% (Organic Self-Funding) | Automation of "Critical 5" handoff boundaries |
| Financing Dependency | +2.4 (Heavy Debt-Reliance) | 0.0 (Fully Cash Self-Sustaining) | Core fulfillment margin reclamation |
| Cash Conversion Cycle (CCC) | 90 Days (Working Capital Trap) | 40 Days (Capital Unlocked) | Fulfillment-to-Cash software integrations |
| Legacy Concentration | 85% (Low-Margin Commodity) | 20% (High-Margin Digital Lines) | T4 Transcend automated innovation pipeline |
| Pricing Integrity | 0.85 (Heavy Market Discounting) | 1.15 (Premium Pricing Power) | Established category-defining brand leader |
| Annualized EBITDA Tax Reclaimed | $430,400 Lost Overhead | +$344,320 Cash Returned | 80% Capital Reclamation Sprints |
Valuation Impact: This operational stabilization de-risked the enterprise asset, de-leveraged external financing, and unlocked an additional +$2,754,560 in equity value at an implied 8x exit multiple.